%
Calls & Minutes Goal Progress
Two simple bars compare completed calls and total talk time against the goals you are working toward.
A single daily view that brings pace, talk time, idle gaps, call frequency, outcomes, and summary metrics together while there is still time to adjust.
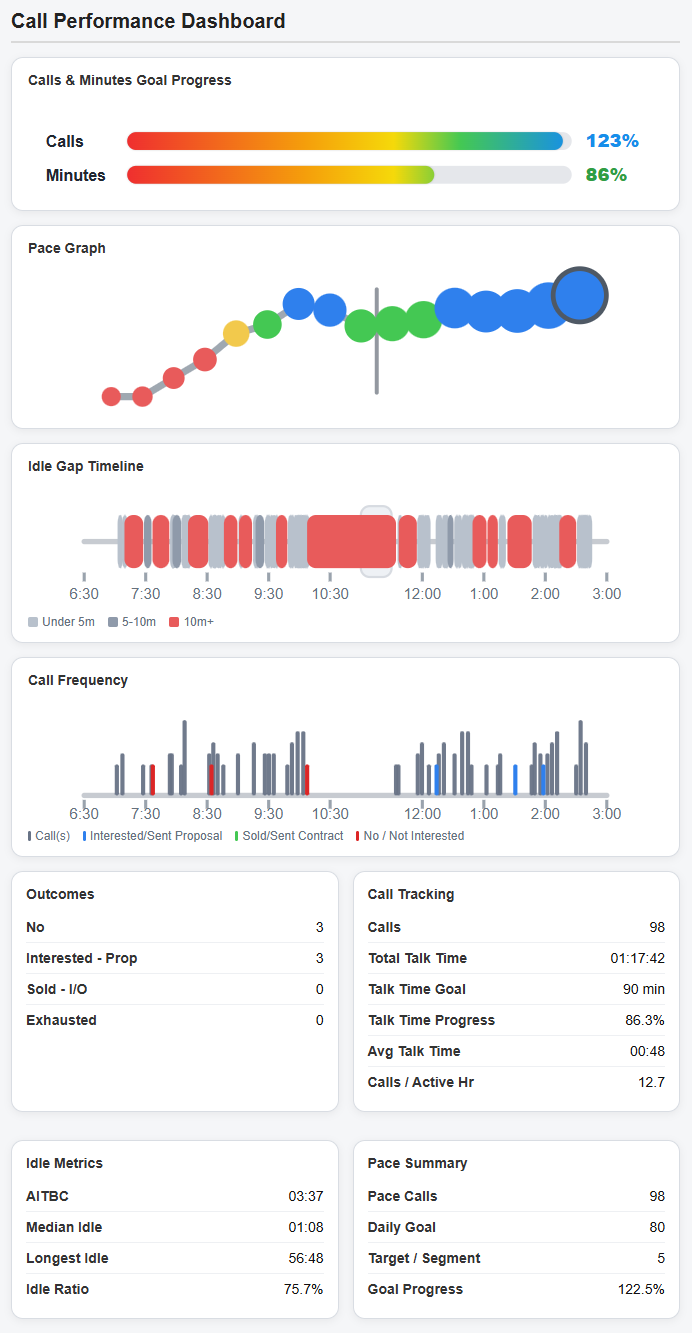
The Call Performance Dashboard is the main daily instrument panel inside CallSparq. It shows not only how many calls have been made, but how the calling day is actually behaving: whether you are on pace, whether talk time is building, where idle gaps appear, and what outcomes are being produced.
The upper graphs provide the fast visual read. The lower report panels provide the exact numbers behind the visuals, including call totals, talk-time progress, average talk time, calls per active hour, idle metrics, and pace summary.
Two simple bars compare completed calls and total talk time against the goals you are working toward.
The pace graph shows whether your calling rhythm is behind, on target, or ahead across the day.
Idle gaps are displayed across the shift so long pauses and dead zones become visible instead of invisible.
Each call appears in time order, with outcome markers that make bursts, lulls, and productive streaks easier to spot.
Outcome totals give a quick count of what happened, not just how many times the phone was dialed.
Call tracking, idle metrics, and pace summary panels give the exact numbers behind the visuals.
Click when you connect. Click when you disconnect. That gives CallSparq all it need to track call counts, talk time, and idle time. A couple more clicks and you can include outcomes in your dashboard. It's designed to be EASY!
Sales productivity is easy to misjudge in the middle of the day. You can feel busy while still falling behind, or feel slow while actually staying close to target. The dashboard turns that uncertainty into a clear picture of activity, rhythm, and progress.
Its purpose is not manager surveillance. It is a private, rep-centered performance view: enough information to notice drift, protect momentum, and make the next useful adjustment before the day gets away.
The goal is simple: see the day clearly, understand what is happening, and correct course while there is still time to finish strong.