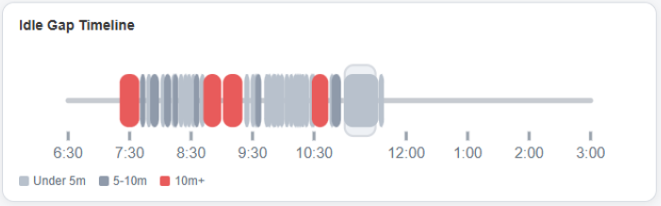
What the graph shows
The Idle Gap Timeline highlights the spaces between productive activities during the day. Every rep has natural pauses, but those pauses can quietly add up when they are not visible.
Short gaps are normal. Medium gaps are worth noticing. Long gaps are the ones that can derail the rhythm of the day if they happen too often or last too long.
Why it matters
Productivity usually does not disappear all at once. It leaks away in small increments: a few extra minutes after a call, a slow reset between tasks, or a distraction that stretches longer than intended.
The timeline helps reps see those patterns without needing a manager report or complicated analytics. It is a personal feedback tool: where did the day slow down, and what can be tightened up before the next block of calls?
The goal is not nonstop activity. The goal is intentional activity, fewer accidental gaps, and better momentum across the workday.